The Ave interface was designed to provide scalable feedback on model matches.
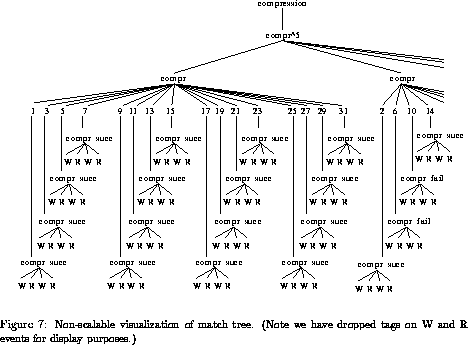
Figure 7 attempts to visualize the match tree produced by the behavioral description given in Figure 6 in a naive way, which is clearly not scalable.
The visualization is swamped by the number of events matched. To provide comprehensible visualizations we must use abstractions. For instance, all the processes taking part in the first iteration (depicted by the left most compr event), exhibit the same behavior - they all participated in an compr_succ. No additional information is provided to the user by depicting each process individually. Thus, in a manner reminiscent of the image compression algorithm, we can collapse identical subtrees below the p-chain level into a single subtree. This would collapse the children of the first compr event into a single collapsed node, and the children of the second compr event into two collapsed nodes. Ave, in an effort to save space gives a high level feeddback regarding the collapsed subtrees - instead of drawing the collapsed subtrees in full, it indicates the total number of subtrees originally present under each p-chain node, and the number of distinct sub-trees present. This high level feedback can be thought of as vertical compression of the match tree. Ave also compresses the match tree horizontally.
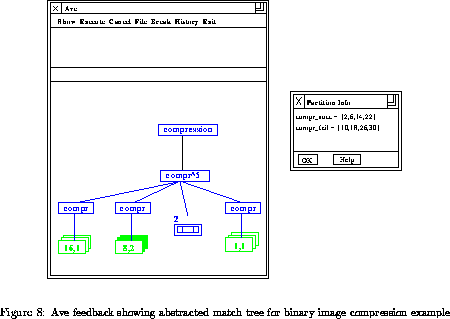
Ave's depiction of the compressed match tree is shown in Figure 8.
It shows compression both horizontally and vertically:
horizontally by eliding sibling nodes and vertically by pruning levels.
Suppressed sibling nodes are represented by a single node with button that
can be used for scrolling through hidden constituents; an integer label
gives the number of these constituents. Vertical compression is indicated
by a summarizing box.
Here, the tree is expanded only to the p-chain level as
indicated by the boxes
below each p-chain. Each box represents an entire subtree rooted at the
p-chain node. It is labeled with an integer pair: the first component
indicates the total number of behaviors (that is, the number of direct
descendents of the p-chain node) and the second component
indicates the number of different behaviors. In this case, 16
processes participated in the first iteration and they all had the same
behavior.
The summarizing label was 16,1. During the second
iteration, eight processes participated and four of the processors
found image segments to merge,
and so there were two different behaviors:
the processes 10, 18, 26 and 30 executed compr_succ and the
remaining processes executed just compr_fail.
The summarizing label
was 8,2. The user can get a description of the partitioning by
clicking on the summarizing node as shown in Figure  .
.
Ave uses color in two ways. The first is to distinguish types of events. It uses