visualizing allometric change
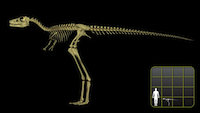
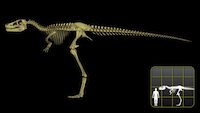
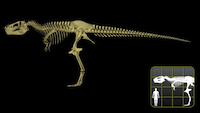
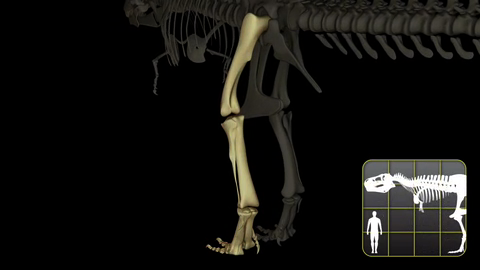
At the 2006 Ottawa SVP I presented a novel means to visualize allometric change between two skeletal models. The first method addresses overall proportional changes across the bauplan by creating an animation in which proportional growth is seen as constant size and positive allometry as growth and negative allometry as shrinkage. The method allows one to use different possible normalization bases. Usually an element such as the femur is used as the basis, but we can select overall axial body length, or acetabular height, or any other dimension of the model as the basis for normalizing the relative growth rates between models A and B. The second method is more sophisticated, and further allows the osteology of each individual element of the skeleton to change in morphology between A and B. This work was done in collaboration with Eric D. Wills and Scott W. Ernst.
Digital animation using this technique provides a means to immediately distinguish between regions of positive allometry, isometry, and negative allometry as the human visual system is particularly capable at observing changes in relative size as well as changes of morphology within the individual elements of a skeleton.
|
"3D VISUALIZATION OF ALLOMETRIC CHANGE IN WHOLE SKELETONS: POSTURE, PROPORTION, AND RANGE OF MOTION"
Allometry, the differential growth of body parts in relation to an entire organism, is usually analyzed and presented graphically, wherein a measure of relative growth is expressed by a power law, for either an intraspecific (ontogenetic) or interspecific (phylogenetic) range of individuals. In contrast, dynamic visualization of a three-dimensional skeletal model that undergoes allometric change provides a more immediate and inclusive grasp of that same progression. To visualize allometry, two or more skeletal models are created parametrically in the DinoMorph software. The modeled individuals that comprise the sequence are homeomorphic, e.g., they have identical phalangeal and vertebral formulae. The models differ geometrically, not only in the major dimensions of corresponding bones, but for each bone, the geometric model capturing its specific morphology is also homeomorphic across the individuals in the sequence. This permits visualization of morphological change for individual bones in addition to appreciating their proportional changes during the allometric progression of the overall skeleton. While conventional allometric analyses frequently use femur length as a proxy for overall body size, the current method permits allometry with respect to reconstructed body size directly, and indeed to test the often-presumed isometry of femur length as a function of overall body size. For animals in which the hind limbs are themselves involved in significant functional change, such as tyrannosaurid allometry, the ability to select other, functionally independent, bases is particularly advantageous. DinoMorph further provides a representation of joint flexibility that quantifies the full six degrees of freedom of relative orientation and position of each articulated pair of bones. As a consequence, changes in posture and flexibility can also be interpolated and appreciated with relation to a given stage of allometric growth. Body movements, expressed relative to the individual achievable range of motion, can then be correlated with allometric change to the entire skeleton. |
 Presentation slides here. Presentation slides here. |
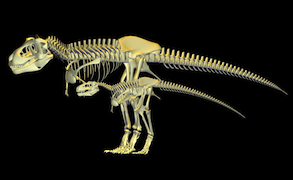
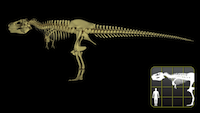
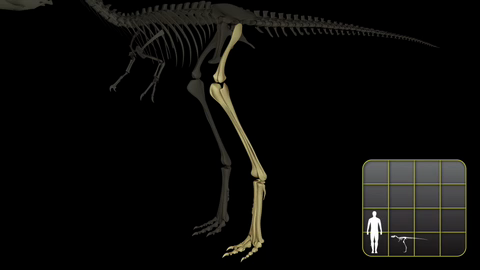
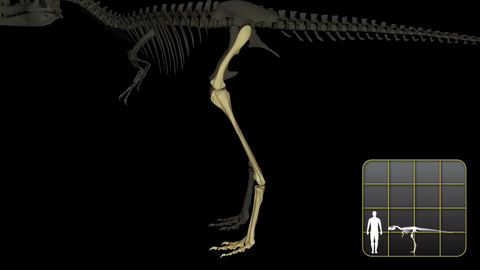
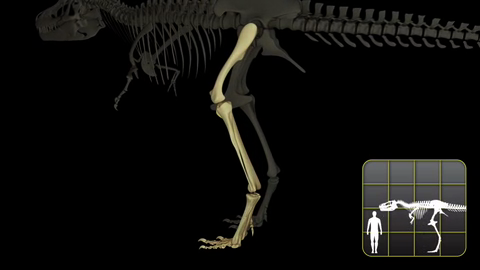
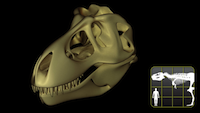
This work was later used to illustrate how a juvenile T. rex might have grown to maturity, for a National Geographic Television special produced by Tom Lucas. Animation and rendering by Scott W. Ernst.
 |
 |
 |
 |
 |
 |
 |
 |
 |
 |
 |
 |