Scientific Visualization of Very Large Data Sets
Introduction
The challenges for scientific visualization on massive data sets are two-fold:
- How do you handle the scale of large data? How do you load a petabyte of data (or an exabyte!) and apply an algorithm to it? What are the right processing techniques? How can you prepare data to expedite processing?
- How do you reduce the complexity of resulting visualizations? How do you simplify the results so our human brain's visual process system can understand it? Because, if you process an exabyte of data but produce the equivalent of random noise on the screen, then you haven't really done anything meaningful...
Selected Current Research Projects
Exploration at the Exascale
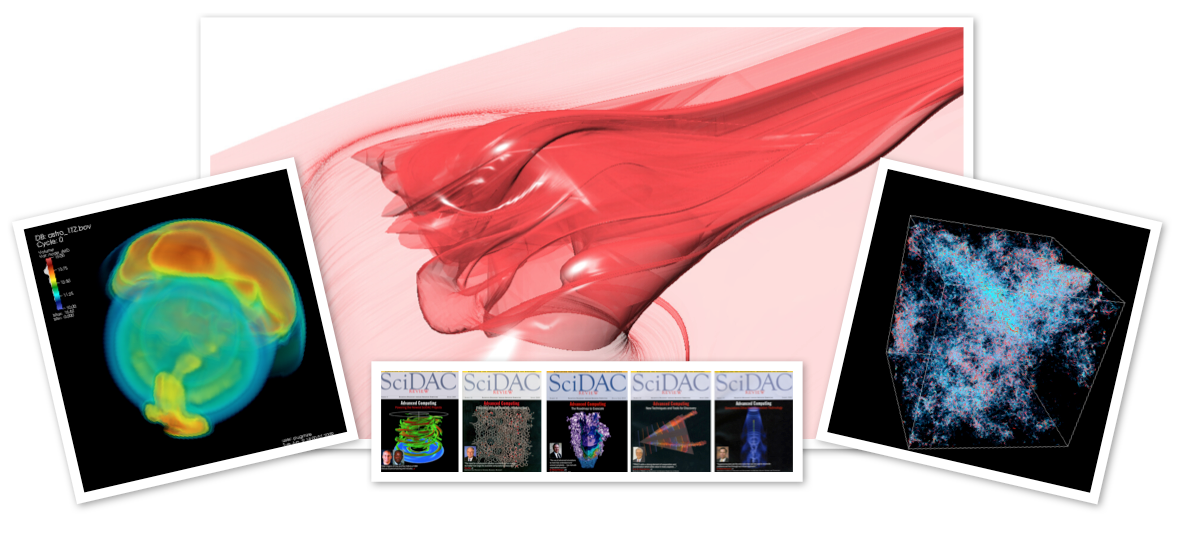
Power constraints from exascale computing (10^18 floating point operations per second) will preclude the traditional visualization workflow, where simulations save data to disk and analysts later explore this data with visualization tools. Instead, we will need to embed routines into the simulation code to massively reduce the data. However, this reduction must be intelligently carried out: if too aggressive, the analyst will not feel confident in the integrity of the data and will and disregard any resulting analyses. In short, this research tackles how to balance the tension between reduction and integrity. The specific research to inform this tension involves areas such as uncertainty visualization, wavelet compression, massive concurrency, and many more. More information about this project can be found here.
Efficient Parallel Algorithms
Many visualization algorithms are difficult to parallelize and even more difficult to make run efficiently in parallel. Our group has recently published new advances for stream surfaces (below, left) and techniques for dealing with complex inputs, specifically adaptive mesh refinement (below, right).

Heterogeneous Algorithms
As compute nodes increasingly have accelerators (such as GPUs), we have to explore the best way to map visualization algorithms onto them and we also have to evaluate their efficacy. Further, although these accelerators provide increased computational power, this power is balanced by increased latencies. In a distributed memory setting -- where accelerators must coordinate their activities via a network -- the optimal way to design an algorithm is rarely the naive one.
Creating Insight from Large Scientific Data Sets
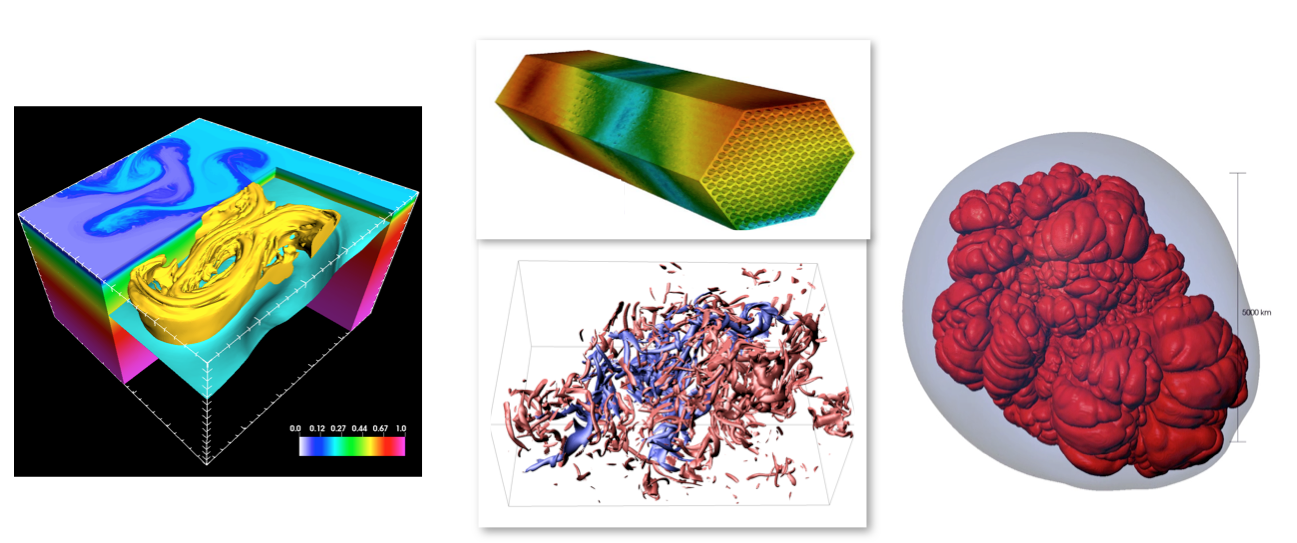
Our group has extensive contacts with end users and performs application-oriented research to help them better understand data. This often means developing new techniques or applying techniques in new ways, such as the Finite-Time Lyapunov Exponent (FTLE)-based analysis of oil dispersion in the Gulf of Mexico (below, left), nuclear reactor design (below, middle-top), identification and analysis of features in turbulent flow (below, middle-bottom), and explosions of stars (below, right). More information about the analysis of oil dispersion in the Gulf of Mexico can be found here.
Collaborations
We collaborate with a number of individuals and research programs:
- The Visualization Group at Lawrence Berkeley National Laboratory (LBNL).
- The Institute for Data Analysis and Visualization (IDAV), a UC Davis-supported Institute that houses a number of visualization and computer graphics researchers.
- The Department of Energy's Institute for Scalable Data Management, Analysis, and Visualization (SDAV), which includes six DOE laboratories, seven universities, and one private company.
- We also collaborate with the Technical University of Kaiserslautern (Germany), with the possibility for students to go back and forth between the universities.
- In addition to LBNL, we also collaborate with Lawrence Livermore National Laboratory and Oak Ridge National Laboratory, with collaborations with Pacific Northwest National Laboratory and Idaho National Laboratory forming. Frequently, these collaborations often lead to our students performing their research on the leading supercomputers in the world today.
- We collaborate with National Science Foundation supercomputing centers as well, primarily with the Texas Advanced Computing Center (TACC) and the San Diego Supercomputing Center (SDSC).
Faculty
Hank Childs, Assistant ProfessorSelected Publications
Here are a few recent publications from the group:
- E. Wes Bethel, Hank Childs, and Charles Hansen, editors. High Performance Visualization-Enabling Extreme-Scale Scientific Insight. Chapman & Hall, CRC Computational Science. CRC Press/Francis-Taylor Group, Boca Raton, FL, USA, Nov. 2012. (Textbook)
- T. M. Ozgokmen, A. C. Poje, P. F. Fischer, H. Childs, H. Krishnan, C. Garth, A. C. Haza, and E. Ryan. On multi-scale dispersion under the influence of surface mixed layer instabilities. Ocean Modelling, 56:16-30, Oct. 2012
- K. P. Gaither, H. Childs, K. Schulz, C. Harrison, B. Barth, D. Donzis, and P. Yeung. Using Visualization and Data Analysis to Understand Critical Structures in Massive Time Varying Turbulent Flow Simulations. IEEE Computer Graphics and Applications, 32(4):34-45, July/Aug 2012
- P. Navratil, D. Fussell, C. Lin, and H. Childs. Dynamic Scheduling for Large-Scale Distributed-Memory Ray Tracing, Proceedings of EuroGraphics Symposium on Parallel Graphics and Visualization (EGPGV), pages 61-70, May 2012. Best paper winner.
- Mark Howison, E. Wes Bethel, Hank Childs. Hybrid Parallelism for Volume Rendering on Large, Multi- and Many-core Systems. IEEE Transactions on Visualization and Computer Graphics, 18(1):17-29, Jan. 2012
- David Camp, Christoph Garth, Hank Childs, David Pugmire, Kenneth Joy, "Streamline Integration using MPI-Hybrid Parallelism on Large Multi-Core Architecture" IEEE Transactions on Visualization and Computer Graphics, 17(11):1702-1713, Nov. 2011
- Hank Childs, David Pugmire, Sean Ahern, Brad Whitlock, Mark Howison, Prabhat, Gunther Weber, E. Wes Bethel. "Extreme Scaling of Production Visualization Software on Diverse Architectures." IEEE Computer Graphics and Applications, 30(3):22-31, May/June 2010.