![[TAU Logo]](../images/tau.xbm)
After compiling an application for profiling and running it, racy lets you browse through the function and collection profile data generated.
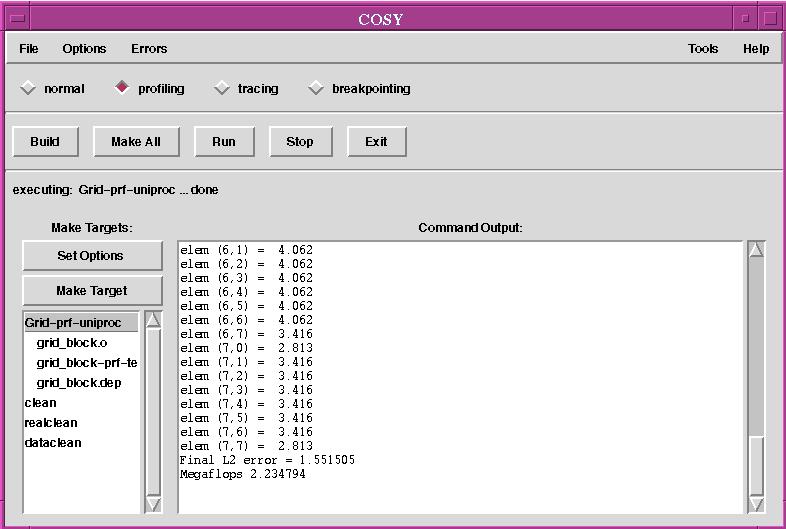
In cosy, click on the checkbutton for Profiling compilation mode, rebuild the Makefile with the Build button, and click Make All to recompile the project for profiling. Then run the instrumented program to obtain dynamic profiling data by clicking the Run button.
|
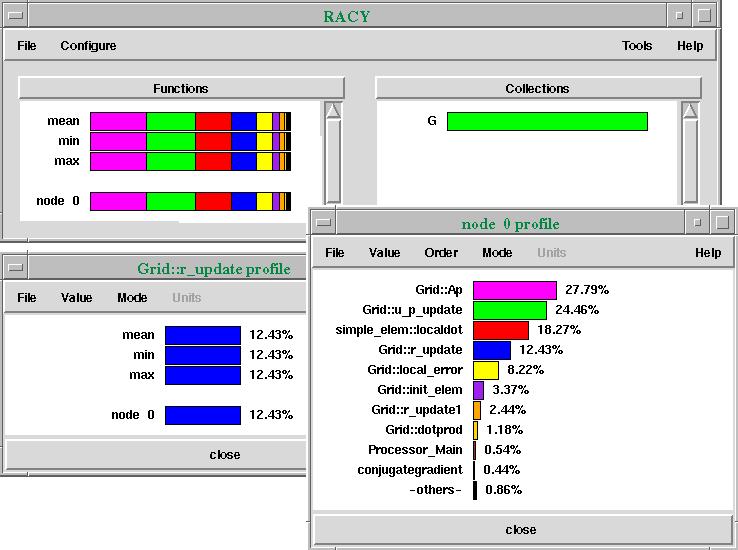
Go to RACY in the Tools menu to invoke it. Go to File and Show Legend to view the color-coding key for profiled functions.
|
![[RACY]](../images/11-racy1.jpg)
To investigate the profile of a function, in the File Legend click on Grid::r_update.
|
Clicking on the node 0 label in either the Grid::r_update profile window or the function portion of the main window shows us the time spent in each function for node 0.
|
Click the right button on the Grid::Ap in the node 0 profile window to investigae this function, which we observe to have consumed the most runtime.
|
This right-click will globally select the function in all running tools. With FANCY still running, we will be shows the source code for the selected function, allowing us to investigate methods of optimization.
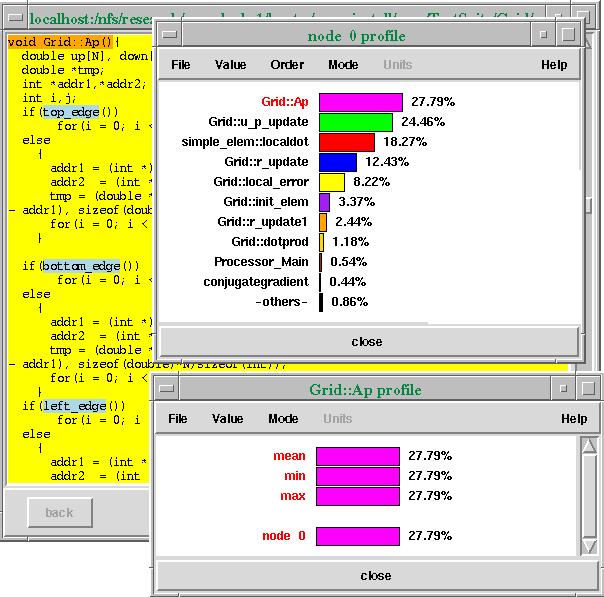
As in the other tools, we can click the middle mouse button to get function information. Furthermore, the Options and Mode menus contain numerous ways to reconfigure the profile displays.
Exit from main TAU window will cause all running tools to exit.Continue with the next button below for links to further in-depth information about TAU.
![[PREV]](../images/prev_ball.gif)
![[Back to tutorial]](../images/back_to_tutorial.gif)
![[NEXT]](../images/next_ball.gif)